from wtlike import *
from utilities.ipynb_docgen import *
source_name = '4FGL J1257.0-6339'

def P88Y3250( clear=False):
    r"""
    ## Variability analysis of 4FGL J1257.0-6339
    {date}

    This source, ~$0.5^\circ$ distant from PSR B1259-63, has a nickname P88Y3250.
    I look at it because it was flagged as variable, index=48.3, so may affect B1259.


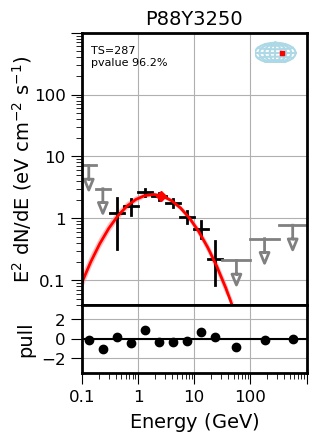
    It is unassociated, with a pointlike TS=287, and flux uncertainty of 0.7%. Its 12-year SED is:

    {sed}

    {out1}

    {out2}

    Here is the light curve, measured in weekly intervals.
    {fig1}

    Note that most of the weeks are limits, except for a few quite significant ones.
    The blue line is the result of the Bayesian block (BB) analysis, which found several blocks.

    The BB fluxes with relative flux >2:
    {bbflux}
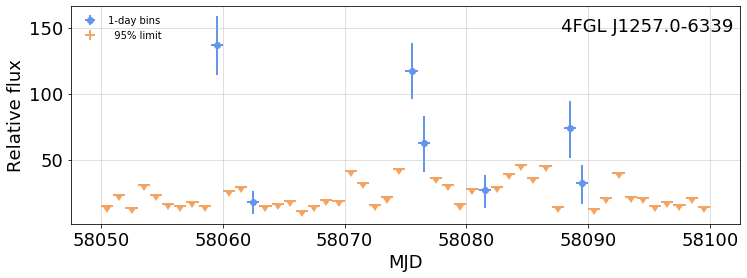
    Here is a an expansion, in daily bins, following the 2017 B1259-63 periastron at 58018:

    {fig2}

    ### Comparison with the [LightCurveRepository](https://fermi.gsfc.nasa.gov/ssc/data/access/lat/LightCurveRepository/).

    {lc_image}
    This shows the energy flux for 3-day intervals, and appears to be consistent with the wtlike analysis.

    ### Conclusion

    This source is not variable--the apparent variability is entirely due to the flares from B1259-63.

    """

    sed = image('P88Y3250_sed_uw1216.jpg', width=250, caption=None)

    with capture_print('Output: load data, add weights, form time bins, fit') as out1:
        weekly = WtLike(source_name)

    with capture_print('BB partition output') as out2:
        bbview = weekly.bb_view()

    fig1 =figure(
            bbview.plot( yscale='log', ylim=(0.5, 200), ts_bar_min=4, figsize=(20,4)),
            width=600, )
    bbflux = monospace(bbview.fluxes.query('flux>2'))

    with capture_print() as out3:
        fig2 = figure(
                weekly.view((58050, 58100,1)).plot( fignum=2),
                width=600)

    lc_image=image('P88Y3250_light_curve.png', width=600, caption=None)

    return locals()

# runs the above, generates the doc
nbdoc(P88Y3250, clear=False)
Implications for the Catalog
This could be done with all 4FGL sources with a relatively small amount of effort.
Computing times to generate this:
- 15' using pointlike to generate a table of weights for energy- and angle- regions
- 10' to load photons in the source region from the compressed FT1/FT2 table for the 11 2/3 years, and apply weights using the associated table.
What would be needed:
- a systematic effort to produce such tables, using the official catalog model with fermipy for all sources.
- Compare all lightcurves for nearby sources to check correlations: for such pairs, or groups, identify which is the culpit, and modify the background assumption for the neighbors.
- A modification of wtlike to change the current background assumption, allowing it to have a fixed and a variable component
Potential result: Detailed, and more reliable, light curves on any time scale for all sources.
Can I enlist volunteer(s)? This especially applies to #1.


