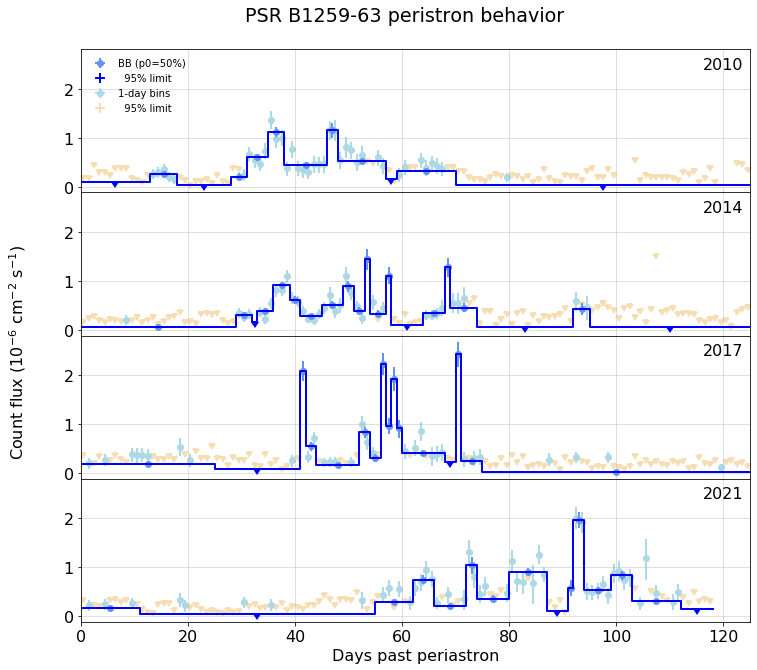
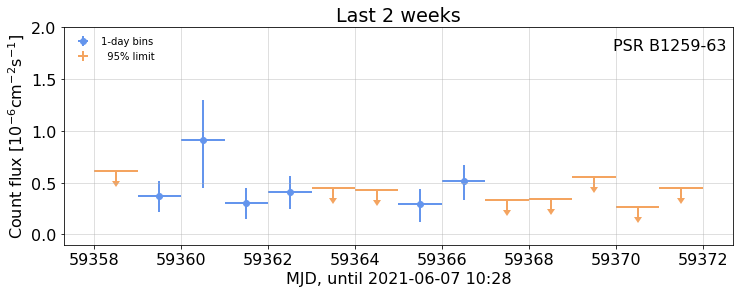
Create a B1259-63 (aka PSR J1302-6350) light curve using Bayesian Blocks
clear = True
#update_cache();
weekly = self=B1259Periastron(clear= clear)
def B1259( clear=False):
    r"""
    ## Fit to all data

    {date}

    Create a `WtLike` object with all the data

    {outp}

    ## The full weekly-interval light curve, showing the BB partitions
    {out2}
    {fig2}
    Table of fits (note that the "flux" column is relative to the 12-year count flux measurement
    6.7e-9 cm**-2 s**-1.
    {bbf}

    ## Expand about each periastron

    #### Periastron dates

    Assuming {period}-day orbital period, the MJD and UTC values are:

    {utc}

    Expand the above, with 1-day bins, following those dates:

    {fig3}

    ## Recent detail
    {out4}{fig4}

    """
    global weekly #  make availlable for follow-up cells


    pd.set_option('display.precision', 4)#, 'display.colheader_justify','left')


    with capture_print('Output from analysis: create cells, fit each, run BB partition, fit partitions.') as outp:
        if weekly is None or clear:
            weekly = B1259Periastron(time_bins=(0,0,7), clear=clear)#.bb_view()
        else:
            print('(already done)')
        bb = weekly.bb_view(0.5)

    bbf = monospace(str(bb.fluxes), 'BB fit table', open=False)

    # fig 2: full light curbe
    plt.rc('font', size=16)

    fig2 = figure( bb.plot(fignum=2, figsize=(15,4), title='Full weekly light curve'),
                  width=600)

    # fig 3 -- stack light curves
    utc = monospace(str(weekly.date_info()))
    with capture_print('Output from periastron analyses') as out2:
        fig3 = figure( weekly.stacked_plots( ylim=(4,300), fignum=3), width=600)

    # fit 4 -- last two weeks
    with capture_print(f'Output, with light curve table, from selecting the last two weeks') as out4:
        recent_wk = weekly.view(-14,0,1)
        print(recent_wk.fluxes)
        fig4=figure(
            recent_wk.plot(show_flux=True, ylim=(-.1,2), title='Last 2 weeks',
                       xlabel=f'MJD, until {UTC(weekly.stop)}',fignum=4),
            caption=None, width=600)

    return locals()

nbdoc(B1259, clear=False)
mdf = d.query('59319>t>59093').copy()
mdf.loc[:,'ts']= mdf.fit.apply(lambda x: x.ts)
mdf.loc[:,'flux']=mdf.fit.apply(lambda x: round(x.flux,1) )
mdf.loc[:,'errors']= mdf.fit.apply(lambda x: (np.array(x.errors)-x.flux).round(1))
mdf.loc[:,'limit']= mdf.fit.apply(lambda x: x.limit.round(1))
#mdf['t ts flux errors limit'.split()].describe(percentiles=[])

### Use the last one, at 59318.5, +63, to make tentative normalization


f = mdf.iloc[-1].fit
print(f'Compare point at {mdf.iloc[-1].t}: TS: me {f.ts:.1f}, Tyrel {tdf.iloc[-1].TS:.1f}')
a,b = f.flux, tdf.iloc[-1].flux; a,b,
print(f'flux ratio check: {a/b:.3e}')

fig, (ax1,ax2,ax3) = plt.subplots(1,3,figsize=(15,5))
ax1.plot(mdf.ts, tdf.TS, 'o');
ax1.set(xlabel='wtlike TS', ylabel='gtlike TS')
ax1.grid(alpha=0.5)
mtscut= (mdf.ts>4).values
ax2.plot(mdf.flux, tdf.flux, 'o');
ax2.plot(mdf.flux[mtscut], tdf[mtscut].flux, 'or', label='wtlike TS>4');
ax2.plot([0,70], [0,70], '--', color='grey');
ax2.set(xlabel='wtlike flux', ylabel=f'gtlike flux x {flux_factor:.2e}', xlim=(0,70), ylim=(0,70))
ax2.legend();ax2.grid(alpha=0.5);

ttscut=(tdf.TS>4).values
ax3.plot(mdf.flux, tdf.flux, 'o');
ax3.plot(mdf.flux[ttscut], tdf[ttscut].flux, 'or', label='gtlike TS>4');
ax3.plot([0,70], [0,70], '--', color='grey');
ax3.legend()
ax3.set(xlabel='wtlike flux', ylabel=f'gtlike flux x {flux_factor:.2e}', xlim=(0,70), ylim=(0,70))
ax3.legend();ax3.grid(alpha=0.5);


