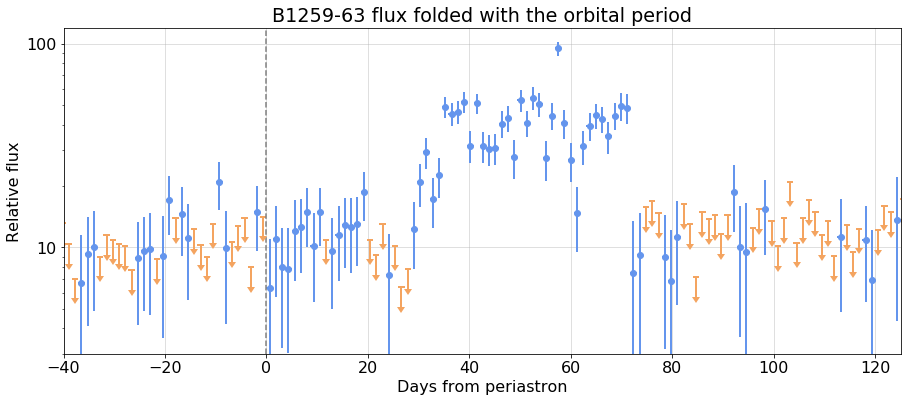
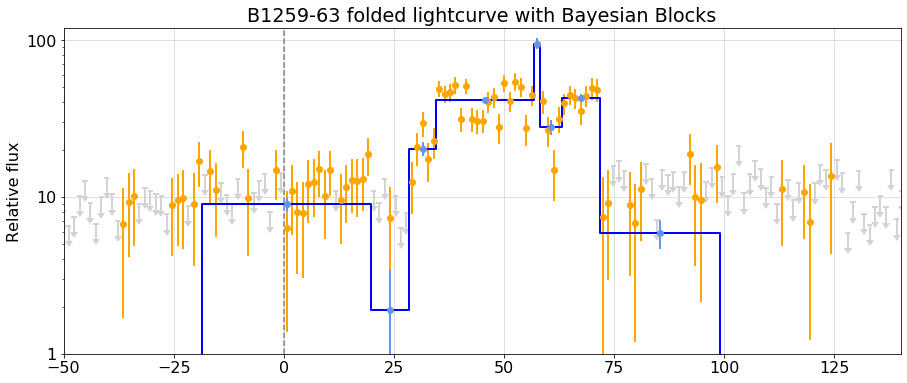
Rebin with time bins aligned with orbit
from wtlike.config import *
from wtlike.cell_data import *
from wtlike.bayesian import *
from wtlike.lightcurve import *
from light_curves.b1259 import *
from utilities.ipynb_docgen import *

config = Config(data_folder='/home/burnett/weekly', verbose=1)

class B1259phased(B1259Periastron):

    def __init__(self, config, first=54683, last=59326, nbins=1000, clear=False):

        # construct bins with respect to phase
        self.interval = interval=nbins/self.period
        self.nbins = nbins
        def mjd2phase_bin(mjd):
            return (mjd-self.tp+self.period)*interval
        def phase_bin2mjd(pb):
            return pb/interval+self.tp-self.period
        first_edge = int(mjd2phase_bin(first))+1
        last_edge = int(mjd2phase_bin(last))
        N = last_edge-first_edge
        phasebins = np.array(list(map(phase_bin2mjd, np.linspace(first_edge, last_edge, N+1) )) )

        super().__init__(config, bins=phasebins, bin_key='B1259_phase_bin_edges', clear=clear)

    def mjd2phase(self, t):
        """return the phase, [-0.5,0.5) for t in MJD """
        r = np.mod(t-self.tp, self.period)/self.period
        if r>0.5: r-=1.0
        return r

    def combine_phases(self):
        """ Fold, and fit cells to a lightcurve  with respect to phase
        """
        cells = self.cells
        cell_width = cells.iloc[0].tw
        cells.loc[:,'phase'] = cells.t.apply(lambda t: self.mjd2phase(t).round(4))

        # check how many of  each phase
        if self.config.verbose>0:
            t, c = np.unique(cells.phase, return_counts=True)
            n, c = np.unique(c, return_counts=True)
            fdf = pd.DataFrame(dict(cells=n, count=c))
            print(f'Combine to {len(t)} phase cells: check number of cells \n {fdf}')

        # group by phase
        gcells = cells.groupby('phase')

        phased_cells = []
        for phase, gcell in gcells:
            newcell=dict(t=phase*self.period, tw=cell_width)
            for col in ' n e S B'.split():
                newcell[col] = gcell[col].sum()
            newcell['w'] = np.concatenate(list(gcell.w.values))
            phased_cells.append(newcell)
        self.folded_cells = df = pd.DataFrame(phased_cells)

        # fold the phases, and make a folded lightCurve

        self.folded_lc = LightCurve(self.config, self.folded_cells, self.source)


    def do_folded_bb(self):
        """Perform Bayesian Block analysis on the folded
        """
        # do the BB to get partition
        self.bb_folded_edges = get_bb_partition(self.config, self.folded_lc)

        # combine the cells
        self.bb_folded_cells = partition_cells(self.config, self.folded_cells, self.bb_folded_edges)
        # fit them
        self.bb_folded_lc = fit_cells(self.config, self.bb_folded_cells,)
phase_bba=None

def B1259_phased():
    """
    ## Run Bayesian Block analysis wwith phased bins

    Define {nbins} bins with {width:.2f}-day width.
    {printout1}

    ### The full light curve with BB overlay:
    {fig1}

    ### After folding:
    {fig2}

    ### Perform the Bayesian Block analysis on the folded light curve
    {printout2}

    Table of blocks, fits:
    {folded_bb_table}

    {fig4}
    """
    plt.rc('font', size=16)
    global phase_bba

    with capture_print('Output from phased bin analysis') as printout1:
        phase_bba = B1259phased(config)
        nbins, width=phase_bba.nbins, 1/phase_bba.interval ;

        phase_bba.combine_phases()

    fig1 = figure(phase_bba.full_plot(fignum=1), width=800)


    fig2, ax = plt.subplots(figsize=(15,6), num=2)
    fig2.width=800
    ax.axvline(0, color='grey', ls='--')
    phase_bba.folded_lc.plot(ax=ax, xlim=(-40,125), ylim=(3,120), yscale='log', ts_min=1.5,
                xlabel='Days from periastron', ylabel='Relative flux', fmt='o',
                title='B1259-63 flux folded with the orbital period',
               )

    with capture_print('Output from Bayesian Block analysis of folded cells') as printout2:
        phase_bba.do_folded_bb()

    folded_lc = phase_bba.folded_lc
    bb_folded_lc = phase_bba.bb_folded_lc
    bb_folded_lc.loc[:,'TS'] = bb_folded_lc.fit.apply(lambda f: round(f.ts,1))
    bb_folded_lc['t tw TS fit'.split()]

    folded_bb_table = monospace(bb_folded_lc['t tw TS fit'.split()])

    fig4, ax = plt.subplots(figsize=(15,6), num=4)
    ax.axvline(0, color='grey', ls='--')
    fig4.width=800
    bb_overplot(config, folded_lc, bb_folded_lc, ax=ax, ts_min=1.5, xlim=(-50,140), fmt='o',
                         colors=' orange lightgrey blue'.split(),
                         yscale='log', ylim=(1,120),
                           title='B1259-63 folded lightcurve with Bayesian Blocks')

    return locals()

nbdoc(B1259_phased)
phase_bba.weight_histogram()[:50]


